 Worrying about the beginning of the school year is something that all teachers do. This year in particular is a whopper. This is an activity that I love and have done now for the past couple of years. This year will be different, so I have modified instructions to include how this activity could function with everyone remaining 6ft apart and also how this could be done for remote learning as well. Some of the aspects of this activity that I love is that in the original design, the kids were able to get up and move around the room interacting with each other, we were able to discuss the basics of the scientific method with a concrete example and there was a built in get to know you section as well. It basically covers everything that the first day of school should be. The basic idea of this activity is that there are mystery items in film canisters that the students cannot see. The objective of the activity is for each student to figure out who has the same item in the canister as they do. They then need so figure out another way to "collect data" to figure this out. Through discussion of this activity, the topics covered include the steps of the scientific method, different ways of collecting data (direct vs. indirect), testing a hypothesis, deciding which pieces of data are useful, and a general discussion about how science works. After that discussion, students would then share answers to "get to know you" questions which are taped on to each canister. Designing the COVID modified classroom instruction was a bit tricky, but I was able to work it out and still get the same ideas of the original activity across. The same thing goes with the remote instruction design. In the COVID modified classroom instruction instead of students milling around the room, they are in two lines, spaced 6ft apart, and go down the line shaking their canister to find their match. Instead of a turn and talk during the discussion, a Padlet is suggested and for the get to know you questions, Flipgrid is suggested. The distance learning changes things a bit, but is intended to be used during synchronous video call learning. The number of canisters is reduced from a full class set to only 6 and they are numbered. The teacher shakes each one while students fill out a chart to keep track of which ones they think match. The rest of the instruction is similar to the COVID modified instruction. To go along with the remote learning instructions, I have also included the google slides for the teacher to show, along with a student digital interactive notebook google slides to go along with it. On the teacher presentation slides, everything in blue are items that students need to answer or include in their digital notebook. This guides the students through the activity and gives space for them to write down their answers to the discussion questions before sharing them with the class. **Bonus materials include the Do Now I use with the 1st day of school, the learning target and the exit ticket for that day. So you would be all set up for the 1st day of remote instruction with no extra effort on your part. How awesome is that! If you are looking for an engaging and meaningful 1st day of school activity, please check out my TpT page
0 Comments
 One of the positives I have found in converting my curriculum into a digital format is that I am able to streamline the directions so that I can reduce student confusion and the number of the same questions asked over and over again. This lesson is a great example. The paper, scissors and glue version of the traveling nitrogen activity requires repeating the directions a number of times and walking students through the first couple of round before they get where to place their passport stamp etc. In this digital version, I was able to fix some of those issues so that the directions are much more intuitive. So even though I will miss students being able to move around the room and use shared supplies, there is definitely a silver lining to going digital. The nitrogen cycle is one of those topics that can be difficult to make interesting because beyond labeling the cycle diagram, what else could you do? Luckily, I have figured out a few different activities that make students a more active participant in their learning by applying the nitrogen cycle to different scenarios and interpreting data. The Texas TEKS discuss both nitrogen and the carbon cycle. I cover nitrogen cycle with ecology and the carbon cycle when we talk about photosynthesis and cellular respiration. It just seems to flow better that way. This is another google slides lesson, where there are built in areas for students to answer questions and input data. I have also reduced student confusion by formatting the slides so the only things students can click on are the boxes they need to use to complete the activities. I will be combining this with my other ecology lessons to create a "digital interactive notebook" for my students this year to reduce not only the amount of paper, but also reduce the amount of items physically being touched and exchanged. Here is the breakdown of this section: Title Slide Slide 1: Reading about the nitrogen cycle- Using the link on the slide, students use the graphic organizer to focus their reading on the nitrogen cycle and sift out the important information. Slide 2: Labeling the nitrogen cycle- Students are given a simple diagram of the nitrogen cycle. They have two tasks they must complete on this diagram. First, they must drag the appropriate labels to each section of the diagram. Second, they must color code some of the arrows to highlight some of the important sections of the nitrogen cycle, such as nitrogen-fixation. Slide 3-14: Traveling Nitrogen Activity- Students are now nitrogen atoms and will travel to different parts of the nitrogen cycle using a dice roll to determine which part they will go to next. They record their journey on the traveling nitrogen passport. Slide 15: Nitrogen Cycle Illustration- Students look back at their traveling nitrogen passport and create their own nitrogen cycle diagram, showing their nitrogen cycle journey. Slide 16: How to keep a fish tank clean?- In this section, students are shown a diagram of how nitrogen is processed in a fish tank. Students are given the scenario where they must analyze the diagram to determine the best way to keep the nitrogen levels in the fish tank low without changing the water constantly. This activity also exposes students to the different forms of nitrogen. Slide 17-21: Nitrogen and Eutrophication Lab- Students are introduced to the idea of eutrophication and the role that nitrogen in fertilizer plays. Students are given the scenario where a farmer needs to use fertilizer on his crops, but he wants to reduce the eutrophication in the nearby lake. First, students must determine the problem, experimental question, independent and dependent variables in the experiment. Then students are shown the experimental set-up. Students are then shown the results which they then must collect data for and interpret. Students complete a CER for the conclusion of the lab by filling in the appropriate sections. Interesting in this lesson? Check out my TpT store. 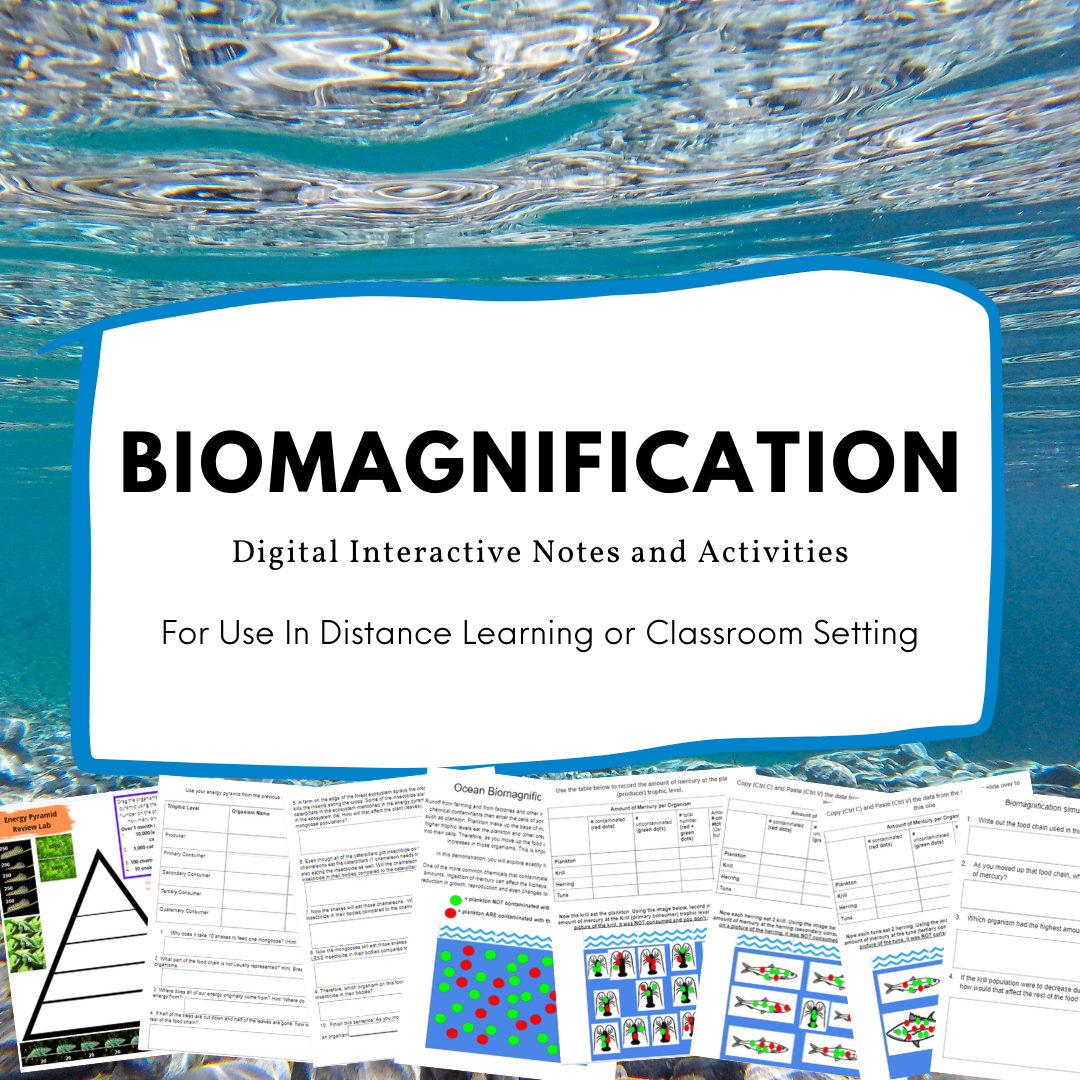 I have converted some of my favorite activities that I do every year with my students into a digital form which can be used in class or remotely, depending on your needs. Since we still don't know what the plan is for next year, I am trying to create lessons which can be used both remotely if necessary or used in class and reduce the use of paper. We usually have student packets, but because we would be trying to reduce the touching of surfaces, I am trying to have everything go digital. This is no small task. It is tricky to figure out how students can still get what they need out of an activity while also making it easy for them to follow along. I am really happy with what I have been creating, as I think it strikes a good balance. Biomagnification or Bioaccumulation is a good topic to cover near the end of an ecology unit, as it covers, food chains, food webs and how changes in the environment can affect both of those. I also enjoy teaching it, as it brings the previous topics into focus which a real world problem that students can relate to. Again, all of the following activities can be used for distance learning or in the classroom. This is formatted as a google slide show, which is easy for the students to follow, and has built in areas for them to answer directly on the slide presentation, which reduces their confusion. Here is the breakdown of what this Google Slide Presentation Includes: Title Slide Slides 1-3: Students review their knowledge of trophic levels, energy pyramids and the 10% rule. Make sure students have prior lessons on this, otherwise this will not make sense. Check out my lessons on food chains and energy pyramids along with food webs FIRST before completing this lesson. Students are given feeding rules for each trophic level. Students then have to drag the correct number of organisms onto each level of the energy pyramid. Students then fill out a data table for each trophic level. Students must then answer analysis questions where they have to relate the 10% rule to the number of organisms at each level, along with applying their knowledge to predict how changes in the environment or the food chain will affect the other populations. Students are then introduced to the idea of pesticide being sprayed and then predict how that will affect this food chain and come up with a basic understanding of how biomagnficiation works. Slides 4-9: Students collect data for an Ocean Biomagnficiation Simulation. Students read about how runoff from human activity can lead to heavy metal contamination in the ocean, specifically focusing on mercury. In the first section, green dots represent plankton that have not been contaminated and red dots represent plankton that have been contaminated with mercury. Students must collect data by counting the numbers of each and recording it in the data table. They will then calculate the amount of mercury in this population. Students then repeat this process moving up this marine food chain and fill out the table as they go. Students then answer questions to that require them to analyze the data and determine what is happening to the amount of mercury as they move up the food chain. Students also given a different ocean food chain and must use their understanding of biomagnification to interpret which organisms have the highest levels of mercury and which are safest to eat. Students must then explain why humans polluting our own ocean comes back to bite us. This will give students an understanding of how human activity can have a large impact on ecosystems, especially those that we rely on for food. Interested in this lesson? Check out my TpT account. 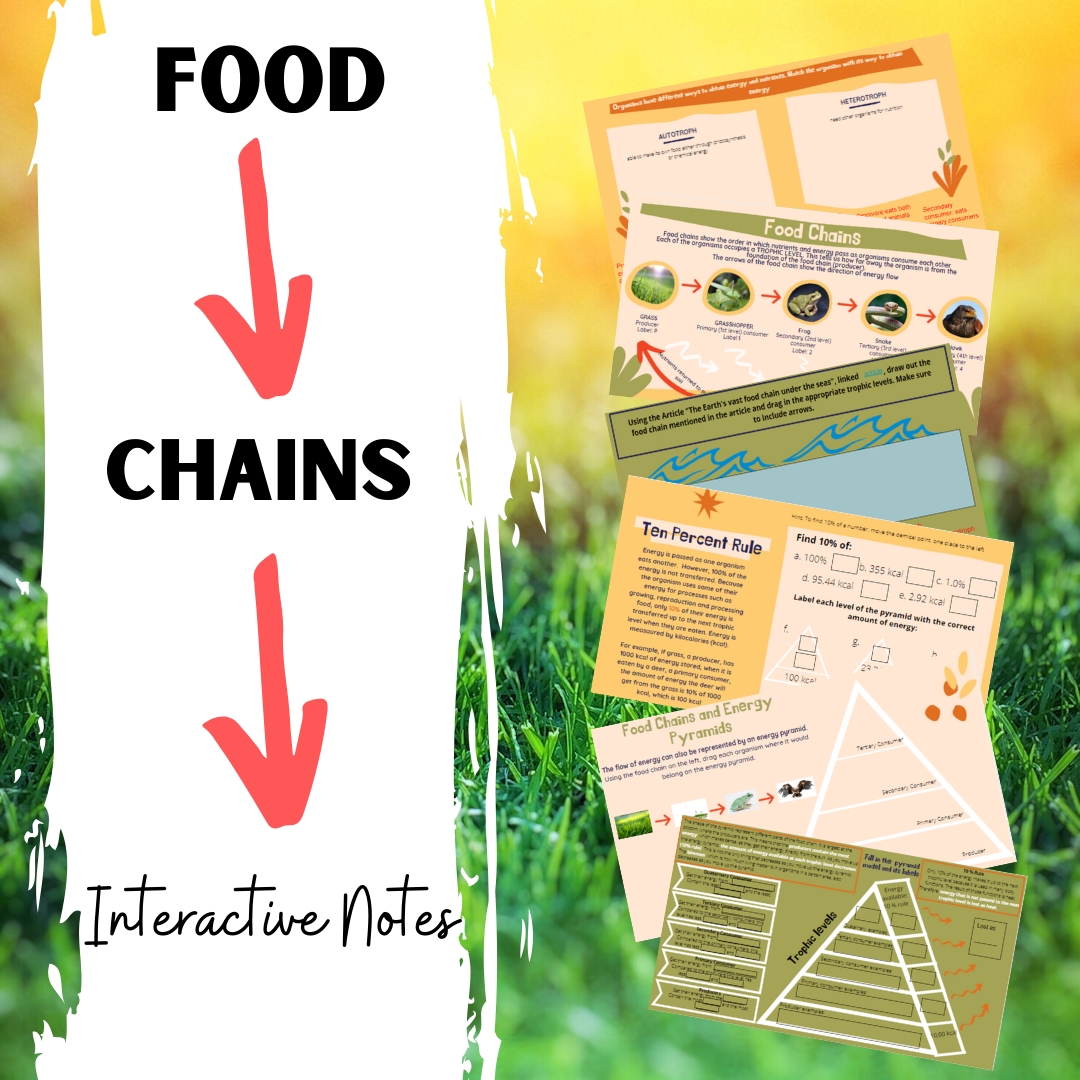 In the sequence of my ecology units food chain would obviously come before food webs, so once your kids have finished this lesson, they can continue onto my lesson on food webs. This is a continuation of my prep for distance learning for next year since we don't really know what is happening. I am just taking the activities I would normally do with the kids and converting them into self-paced activities. The concept of food chains is usually familiar to my students, as they have had some exposure to it in middle school. However, the introduction of the 10% rule usually gives some of then a challenge. I also wanted to make sure I included an emphasis on relating the pyramid to biomass, as past released STAAR exams (Texas state exams) have asked students to relate biomass to energy. I don't go too in depth on the nuances of biomass, I just want them to have been exposed to the idea. Again, these activities are all on google slides, so there are built in areas for students to answer questions. After this bought of distance learning, I have found that was MUCH easier for them to figure out than trying to open a PDF with DocHub or Kami and then annotate through that. Any reduction in the number of steps it takes them to access the curriculum is a win-win situation. Also make sure to check out the video preview below! So here is a breakdown of each activity: Title Slide Slide 1: Vocabulary Connections- Student have a list of vocabulary with definitions which covers the different ways that organisms can process food (ex. herbivore), along with the trophic levels (ex. producer). Students must then drag the word/definition to either the autotroph box or the heterotroph box. The terms autotroph and heterotroph are defined, so students must connect which words fall under each category based on the definitions. Slide 2: Food Chain Introduction- A food chain example is shown with the appropriate labels. The term trophic level is covered, as well as what the arrows represent. Decomposers are also included in the food chain. Slide 3: Food Chain Literacy- Students read the article "The Earth's vast food chain under the seas" and draw a food chain from the organisms mentioned in the article. Students then drag the appropriate labels to each organism on the food chain. Slide 4: Food Chain Research- Students use the link, to pick a biome from this website (great biome review), and build a food chain for that biome, labeling it. Slide 5: Food Chains and Energy Pyramid Connection- Using an example food chain, students drag each organism in the food chain to where they would be placed on the energy pyramid. Students are guided to realize that a food chain can also be represented in this way. Slide 6: 10 % Rule- Students are introduced to the 10% rule, how to calculate it and the biological significance. Students then practice calculating 10%, and then move to filling in energy pyramids using the rule. Slide 7: Energy Pyramid- Students read about the shape of an energy pyramid and how it is related to the loss of energy. Then biomass is mentioned as well in relation to the pyramid shape. It is also mentioned that the energy not passed on to the next trophic level is lost as heat. Students use this information, as well as previous information from the past slides to fill in blanks on trophic level description, examples of organisms at each trophic level, and calculating energy lost at each trophic level. Slide 8: Energy Pyramid Extension Questions- In a series of questions, students are asked to think about the connection between decreasing biomass and energy. Students are also ask to analyze why a food chain usually consists of 5 or less levels. If you are interested in this lesson, please check out my TpT account! Thanks! |
AuthorWrite something about yourself. No need to be fancy, just an overview. Archives
August 2021
Categories |
 RSS Feed
