 When I was trying to think about the best way to tackle labs for this year, I always went back to students viewing the actual lab through a video or doing a virtual lab and then focusing on the data analysis portion of the lab. And since Flash won't be supported by Chrome after December (which wiped out most of my virtual labs), I had to really focus on data analysis as the main point of labs this year. But when you really think about it, the data analysis part is the ONE part that we really need kids to know and the part that they struggle with the most. So overall, given everything, I think this is a viable option. So that made me really want to create a separate introduction to data analysis section since this year's curriculum will focus so much on it. I recommend that you also pair this with my Experimental Design and Data Tables lesson, which could be done before this. Once you complete these two lessons, students will be able to design an experiment, graph it as well as analyze the data. This lesson, as always, can be done synchronously or asynchronously. I do recommend that there is some discussion at some point as a whole class or in small groups to address any misconceptions or issues. These are formatted as student digital interactive notebook pages, where students can fill in their responses directly. This would also be perfect to have in your pocket as an emergency sub lesson plan. Students could complete this at any point throughout the year. Don't forget to scroll down to the bottom for a video preview. Here is the breakdown for the lesson: Title Slide Slide 1-2: Analyzing Data: Students are given example data tables and are asked questions about the tables. Slide 3: Interpreting Data- Pointers Students are given a bullet pointed list of where to look on a graph to figure out its meaning Slide 4-9: Practice Interpreting Data Students are given different types of graphs and have to answer questions based on the graph. Bar chars, line graphs and pie charts are included. This also includes an activity where students are given 4 graph and they must drag the correct "story" that fits each graph. Slides 10-15: Making Data Meaningful Mean, median, mode, range and outliers are covered. Students are given examples and required to complete easy example calculations. Slide 16: Put it all together Students are given 3 data sets and must calculate all the statistical measures previously covered. Slide 17-19: Let's Practice- Science News for students Students are given a link to a real-life data set with pie chart. Students are then asked some questions about the graph and then must relate those analyses to its real-world meaning. Interested in this lesson? Check out my TpT store.
0 Comments
8/25/2020 0 Comments Scientific Method Remote LEarning Unit: experimental design, Data Collection And Graphing My main frustration when I always wanted to teach my kids the different types of variables, data, how to make a data table, how to graph and which type of graph to use was that everything I found was always WAY too advanced. It would work great for my IB or AP kids, but not for my freshmen, who STRUGGLE with graphs and math in general. So I have now created my own that covers all the major topics of experimental design, data collection and graphing, but on a very basic level. This lesson assumes that have had some basics of algebra and know what an x and y axis are, but other than that, it goes over everything you need to get your students started with experimentation. This is made in a digital interactive notebook format. You can do this with the kids or they can do it asynchronously. Don't forget to scroll all the way to the bottom for the video preview Here is a breakdown of the lesson. Title slide Slide 1 Data Collection: Research Question and Hypothesis- The difference between a research question and a hypothesis is described using one of the examples we will carry through the entire lesson. Slide 2 Data Collection: Write a hypothesis for each research question- Students are given 4 different research question that will be used as examples throughout, and students write in the corresponding hypothesis for each. Slide 3 Data Collection: Independent vs. Dependent variables- The differences between the variables are described using the experiment example carried through this entire lesson. Slide 4 Data Collection: Identify the Dependent and Independent variables in the examples- Students are given 4 short descriptions of experiments, and must identify the 2 types of variables for each Slide 5 Data Collection: Experiment vs. Control- The differences between experiment trials and controls to those experiments are described along with how to run a separate control experiment. Slide 6 Data Collection: Identify the experiment and the control in each example- Students are given 4 examples. and must determine what the experiment trials include, and what factors were controlled in the experiment as well as if there was a separate control experiment (not present in every experiment) Slide 7 Data Collection: How many experiments should I do? - Sample size and appropriate number of trials are covered. Slide 8 Data Collection: Type of data- Quantitative vs. Qualitative data are described. Slide 9 Data Collection: Identify Quantitative vs. Qualitative data- Students are given 4 examples of experiments. They must determine what the quantitative data is and what the qualitative data is. Slide 10 Data Collection: Does your question answer your research question/hypothesis?- Questions are posed to students so that can think if the data they are collecting actually ANSWERS the question they posed. Slide 11-12 Data Collection: Match the correct data with each hypothesis- Students will drag the correct pieces of data (there may be more that one) that would help to answer the hypothesis Slide 13 Data Collection:- Students are reminded that they need to think about everything previously covered BEFORE creating data tables and actually doing the experiment. Slide 14-15 How do I make a data table?- Helpful tips and examples are described to help students create data tables. Slide 16 Data Table Practice- Student construct a data table for the given experiment. Slide 17 How do I make a graph?: Graph checklist- Students are given a checklist for the creation of basic graph and are given a link to a video to reinforce these ideas. Slide 18 How do I make a graph?: Practice- Student drag the elements of a graph onto the correct position given graph "paper" Slide 19 Make a graph on Google Sheets- Students are given instruction on how to create graphs on google sheets. Students can click on the link to see an example on google sheets. Students click on the second link and are given a data table .They use the given data table to create a graph on google sheet and then copy and past the graph in their notebook. Slide 20 How do I know which graph to use? Students are given basic criteria to help them determine which graph would fit their data. Slide 21 Type of graph practice- Students are given 5 different descriptions of research questions. Students will then determine which type of graph should be used to represent the data. Interested in the lesson? Check out my TpT store  Ah, the CER. I can hear my students groaning now. Teachers LOVE it. And why not? It forces the students to analyze data, critically think and practice their writing (and/or speaking) skills. This year, I have created an introduction to the CER so that when you bring it up for real, the kids will not be groaning this time (ok, maybe well just a little). This can be used for ANY subject, and it has a great "get to know you" component, which you can never have enough of in the beginning of the year. I use CER's frequently, so showing students what to expect and how they work is really 75% of the battle. Once they get that reasoning does NOT mean just repeating your evidence, and what each section entails, it is smooth sailing. Really the reasoning is always the toughest part for students to grasp, but I think this lesson does a good job of what a reasoning section is and how to create one. This lesson does include both the teacher slides to do with your students (synchronous learning) and the student "digital interactive notebook" slides for the kids to do along with you. This could also be done asynchronously by adding some of the teacher slide instructions to the student slides. You also get the DO Now for students and even the learning target for the day. So you are all set! Make sure to scroll down to the bottom for a video preview of the lesson. The breakdown below is just of the student "digital interactive notebook" slides: Title Slide Slide 1: Do Now- Students watch a commercial and write down what they think the evidence and the claim of the commercial are. Students also write down the learning target for the day. Slide 2: Write a CER-Students are given a graphic organizer to fill out as the whole class debriefs about the commercial. The teacher slides walk the students through each part of the CER, using the commercial as an example. Students will be able to come back to this example later in the lesson as well as the year. Slide 3-4: Commercial CER- Students are given 3 different videos of commercials to choose from. They will fill out the same graphic organizer on their own this time for the commercial of their choice. You can debrief as a whole class or individually with students later on. Slide 5-7: What's in the teacher's bag?- A bunch of "items" have fallen out of the "teacher's" bag and students must use those items to fill out he 6 CER statements about the teacher. You can delete my example items and come up with your own so that the students get to know you, or use the ones I provided. I did throw in some extra items that are not relevant to the 6 statements to reinforce the facts that not EVERY pieces of data is relevant to the question you are answering. Slide 8: What's in my bag?- Students will now create their own "bag" with 6 items in it that tells us about themselves. Students will also create 6 sentence stems that they want us to complete using the items in the bag. I would then suggest that students are broken into small "breakout" session and the group creates CER statements for each person. I suggest using goggle jamboard for each group, but you could also assign each group a google doc, slide, sheet etc. It just needs to be something that they can all see and type their statements on and then type the evidence and the reasoning next to the claim. Each group can then submit their 1 assignment. Interesting in this lesson? Check out my TpT store.  The question is: How do I go over how to use safety equipment when my students have none at home? This lesson is your answer! If nothing else during this time, I have really learned how to be creative in getting students the "hands-on" learning that they need. This section of the year can be particularly dry, yet it is SO important. Safety rules are interesting as most of them are common sense ( you would think) and students have heard them over and over since they were in elementary school. That is why I don't spend a ton of time going over the rules outright, however, I have students analyze issues with case studies. This is one of the best ways I have found that gets students thinking without boring them out of their minds. And at this point of the year, they are still scared of me (lol) so that WOULD let me bore them out of their minds. Later in the year, not so much. Gotta love the honeymoon phase. This lesson includes both the teacher slides as well as the student digital notebook to accompany it. So you are all set! The breakdown below is for the student digital notebook. Also be sure to scroll down to the bottom for a video preview. Here is the breakdown of this lesson: Title Slide Slide 1: Welcome/ Do Now- Students view a microscope slide image and make observations about it. They also record the learning target for the day. Slide 2: Science Tools Ruler- Students measure the beetle on the slide by dragging the ruler in to measure. Students then practice converting mm to cm. Slide 3 : Science Tools Electronic Balance- Students write down two different measurement by reading them on the balance. If you want to discuss significant figures, then this would be a good time to do that. Students also practice converting g to kg. Slide 4: Science Tools Graduated Cylinder- Students learn how to properly read a graduated cylinder and must record the measurements on two different examples. Students also practice converting ml to L. Slide 5: Microscope virtual lab: Using the link provided, students learn about the different parts of the microscope. Students them label the microscope parts in their notebook. Slide 6-9 : Microscope virtual lab: Using the same link, students view different microscope slides and practice drawing what they see as well as record some observations about each slide. Slide 10: Measure you favorite object- This is used as both a "get to know you" activity as well as a hands-on activity. Students use a ruler or a link to the apps provided for a digital ruler, to measure the length and width of an object in their house that brings them joy. Students can then be broken into smaller "breakout" rooms where students share the measurements and other students have to guess what it is. After 3 guesses, then the student reveals the object and explains why it is important to them. This is basically big kid "show and tell". Slide 11: Which tool works best- This relates back to the learning target provided. Students are given 4 different experiment scenarios and must decide which of they tools they learned about would be appropriate to measure this particular set of data. Slide 12: Virtual Classroom Safety Tour- Teachers can walk around the room with an show the class the different safety equipment such as the eye wash, safety shower etc. I left this open for the teacher to customize the student notebook to fit their particular room placement. Students will then drag the safety items into their location in the room layout. Slide 13: Safety Case Study- Students read the paragraph describing what is happening in an experiment. They count the number of safety rules broken and then write below how they would solve those issues. Slide 14: Safety Meme- Students are given a link to help them create a meme about a safety rule. Students will take a screen shot and paste it in their digital notebook. Interested in this lesson? Check out my TpT store. 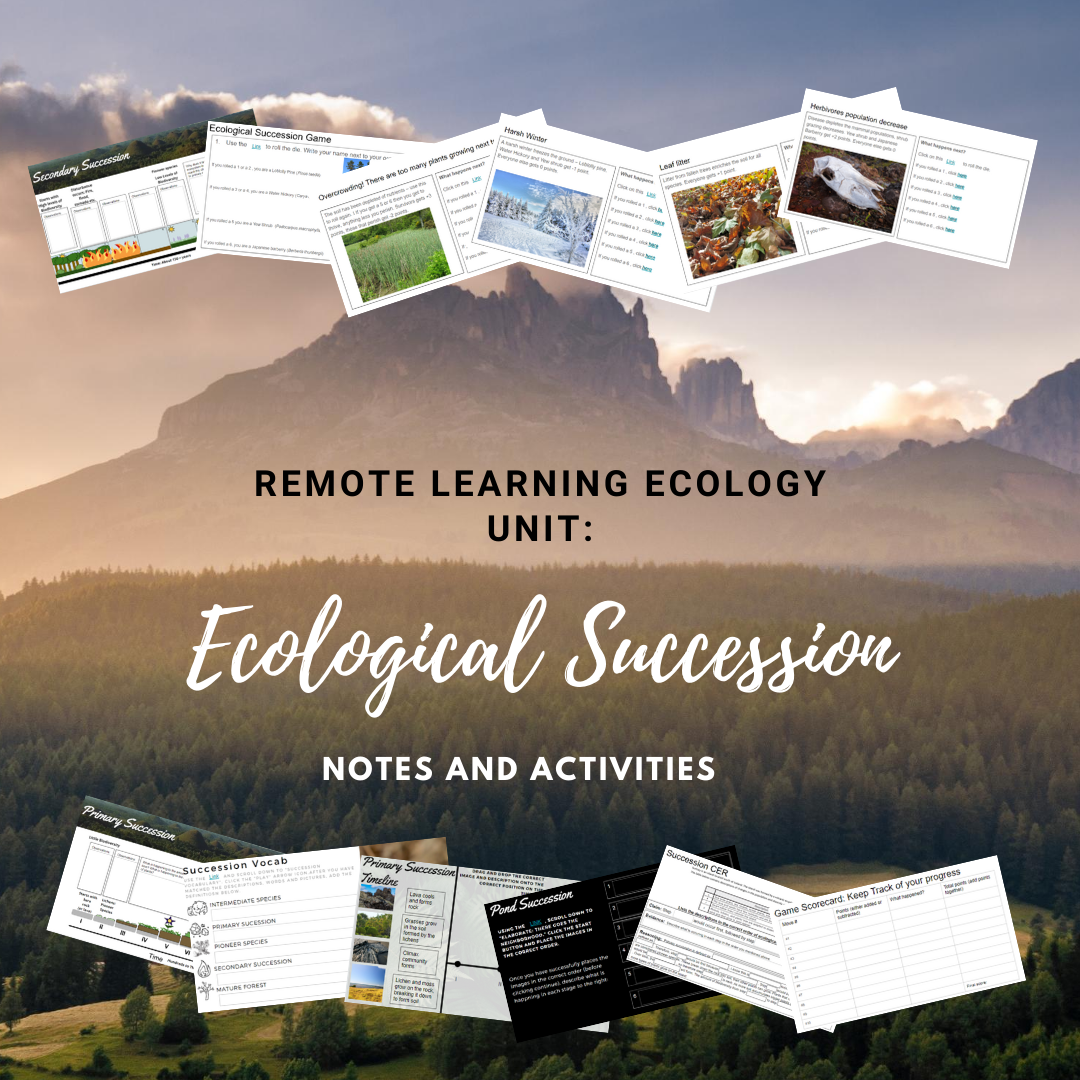 , I used to have such a difficult time with ecological succession. It is a difficult concept to teach at a more basic level because it does require some background knowledge of ecology and critical thinking. Therefore, creating engaging, yet worthwhile activities has take me awhile. I do think that the digital aspect of these activities really enhances their usefulness in the classroom. This lesson set is really one that is great for ELL students, as there are pictures, hands on activities and a variety of way that they can engage with the material. Make sure to scroll all the way down for a video preview of the lesson. Here is a breakdown of the lesson: Title Slide Slide 1: Engagement slide- a picture of plants growing in a lava field is shown to students and they need to explain how this occurred. Student will tap in to their prior knowledge. to answer this. Slide 2: Primary Succession notes- Students are shown an diagram of the process of primary succession. Students write down observations at certain stages, and respond to questions about the diagram at others. Slide 3: Secondary Succession notes- Students are shown an diagram of the process of secondary succession. Students write down observations at certain stages, and respond to questions about the diagram at others. Slide 4: Succession vocab- Students are given a link and asked to scroll down to the section that says "succession vocabulary". Students click "play" and match the pictures, description and words together. Students then record the definitions on the slide. Slide 5: Primary succession timeline drag and drop- Students are given 4 images, 4 descriptions and 4 locations on the timeline. They then must drag both the correct picture and description in the correct location. Slide 6: Secondary succession timeline drag and drop- Students are given 4 images, 4 descriptions and 4 locations on the timeline. They then must drag both the correct picture and description in the correct location. Slide 7: Pond Succession- Succession does not only occur on land. Using this link ,students scroll down to the "pond succession" activity. Students must place the images showing the pond succession in the correct order. Once they have checked their answers. students will record descriptions of each stage on the slide. Slide 8: Succession CER- Students will use fill in the blank sentences and sentence stems to respond to a question concerning the order of ecological succession on an island off of Iceland. Students must use their analysis skills to reconstruct the correct order. Slide 9-34: Ecological Succession Game- Student pick a 1 out of the 4 possible species to represent them and using a dice roll, move through different events that can either move ecological succession forward or hinder it. The goal of the game it to get as many points as possible. The higher the score, the further along in ecological succession the plant becomes. Even though this game can be played individually, students can also compare scores at the end. This is a great discussion jumping off point. Students record their progress in table as they go and then answer analysis questions at the end. The slides are linked so that when the student rolls the die and lands on a number, they simply have to click on that number and it takes them automatically to the next event on a different slide. This is a fun way for students to truly understand some of the biotic and abiotic factors that influence succession. Interested in this lesson? Check out my TpT store. |
AuthorWrite something about yourself. No need to be fancy, just an overview. Archives
August 2021
Categories |
 RSS Feed
